

توضیحات
Analyzing Statistics
This chapter explains in detail how the statistics view works. Refer to Analyzing Process Maps and Analyzing Cases to learn how to use the map and cases views.
The Statistics View
While the Map view (see Analyzing Process Maps) gives you an understanding about the actual process flow, the Statistics view provides you with additional overview information and detailed performance metrics about your process.
Depending on the statistics view that you have selected on the left (4-7), the following information areas are shown:
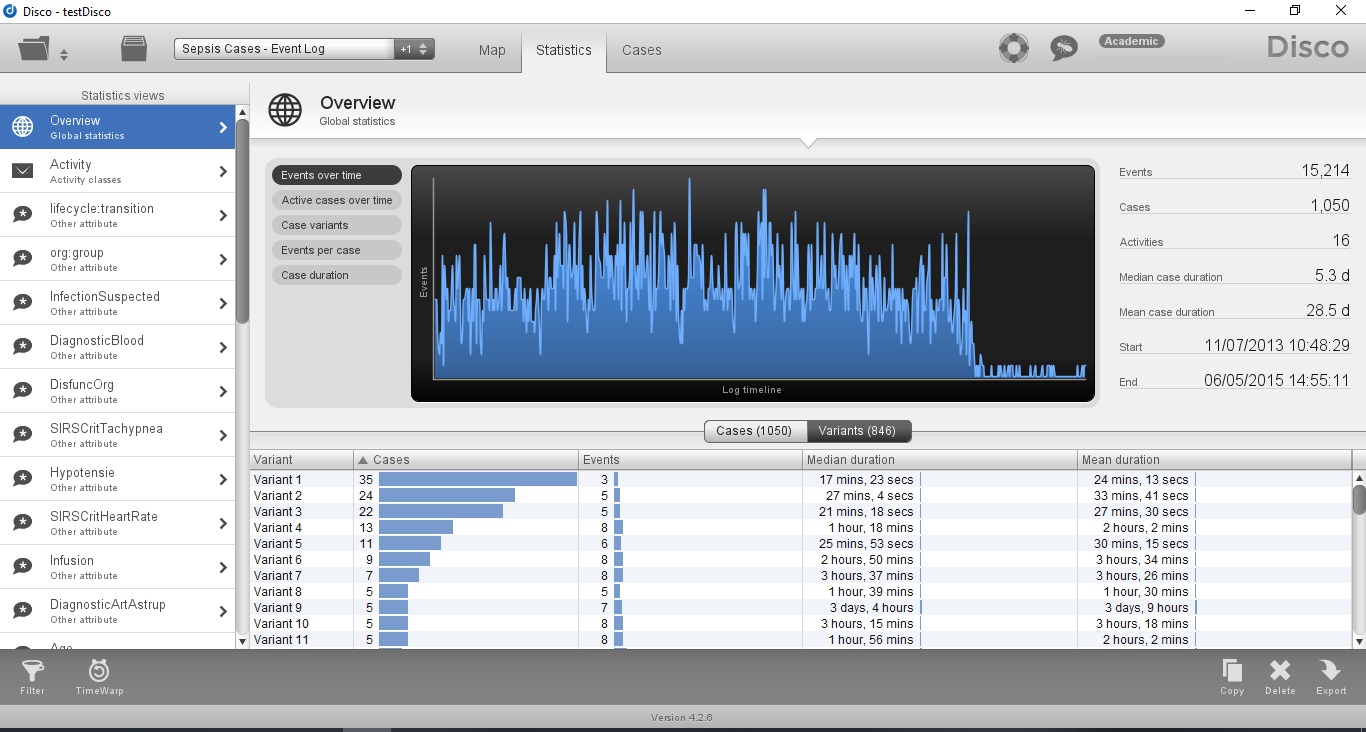
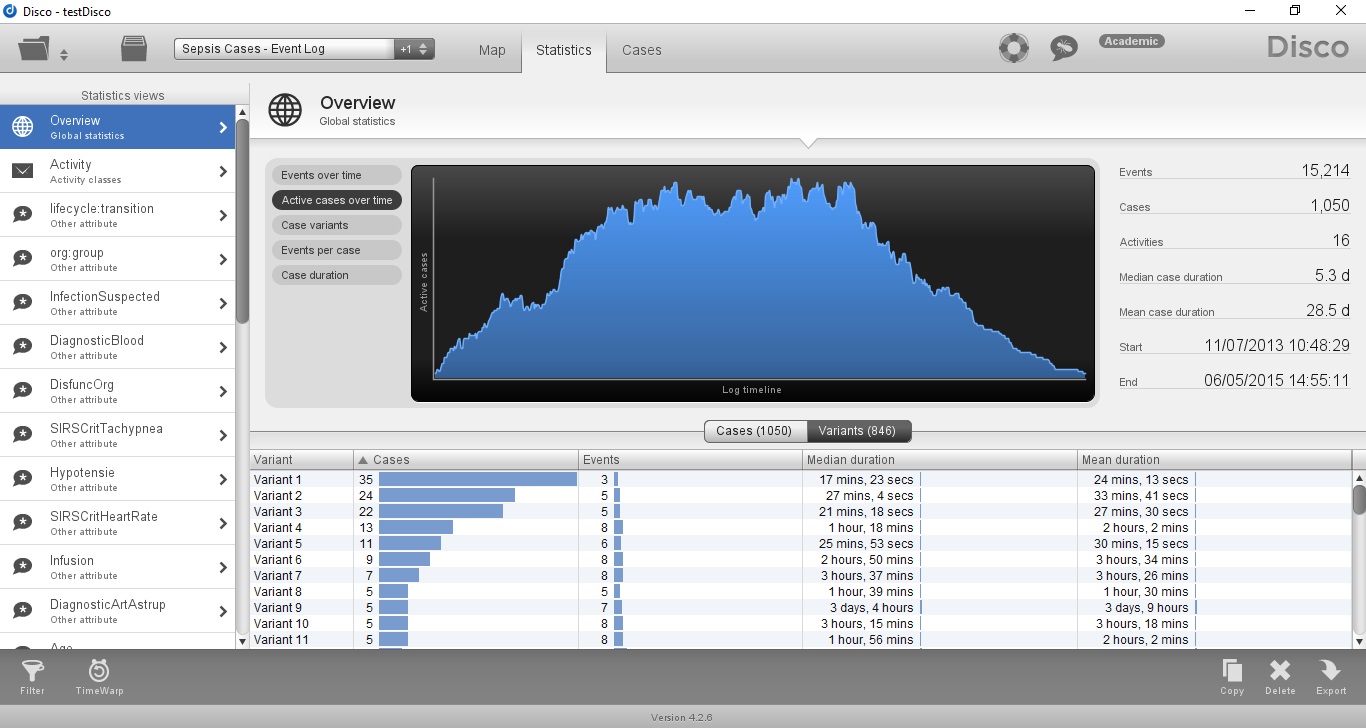
- Overview information (1)
- Key overview figures about the selected statistics view. For example, for the global statistics shown in Figure 1, you can see how many events and cases are in your data set, how many different activities there are, what the median and mean case duration is, and which time frame is covered in the log.
- Performance charts (2)
- A number of pre-generated charts visualize relevant performance metrics for the current statistics view. Charts can be exported as explained in Exporting Charts and Tables.
- Detailed information (3)
- In the lower part of the screen, detailed statistics are shown in a table format. Every table in Disco can be exported as a CSV file to further process the information with other tools such as Excel or Minitab. Refer to Exporting Charts and Tables to learn how to do that.
The statistics are organized into the following views:
- Global statistics (4)
- Overview statistics about the whole data set (see Overview Statistics), individual cases (see Case Statistics), and variants (see Variant Statistics).
- Activity statistics (5)
- Statistics about the different process steps in your data set (see Activity Statistics).
- Resource statistics (6)
- Statistics about the people or organizational units in your data set (see Resource Statistics).
- Attribute statistics (7)
- Statistics about all further attributes (see Attribute Statistics).
Finally, like in any of the three analysis views (Map, Statistics, Cases), you have the following functionalities available at the bottom of your screen:
- Filtering (8)
- The log filter controls for the current data set can be accessed from each of the analysis views. Filters are really important drill into specific aspects of your process and to focus your analysis. Read the Filtering chapter for detailed information on how filtering works in Disco.
- Copy, Remove, and Export data set (9)
- Data sets can be copied (see Copying Data Sets) and deleted (see Deleting Data Sets) right from the current analysis view. Process maps and data sets can be exported via this export button in the lower right corner. Cases, variants, statistics and charts can be directly exported via right-click from the Statistics view. You can find a detailed overview about all export functions of Disco in the Export chapter.
تحلیل آمار
این حالت به تفصیل نحوه عملکرد نمای آمار را توضیح میدهد.
نمای آمار
در حالی که نمای Mapدرکی از جریان واقعی فرآیند به شما میدهد، نمای آمار اطلاعات کلی اضافی و معیارهای عملکرد دقیقی در مورد فرآیند شما ارائه میدهد.
بسته به نمای آماری که انتخاب کردهاید، حوزههای اطلاعات زیر نشان داده میشوند:
اطلاعات کلی (1)
ارقام کلیدی کلی در مورد نمای آمار انتخاب شده. به عنوان مثال، برای آمار کلی میتوانید ببینید که چند رویداد و مورد در مجموعه دادههای شما وجود دارد، چند فعالیت مختلف وجود دارد، میانگین و میانگین مدت زمان مورد چقدر است و کدام بازه زمانی در گزارش پوشش داده شده است.
نمودارهای عملکرد (2)
تعدادی از نمودارهای از پیش تولید شده، معیارهای عملکرد مربوط به نمای آمار فعلی را تجسم میکنند.
اطلاعات دقیق (3)
در قسمت پایین صفحه، آمار دقیق در قالب جدول نشان داده شده است. هر جدول میتواند به عنوان یک فایل CSV برای پردازش بیشتر اطلاعات با ابزارهای دیگر مانند اکسل یا مینیتب صادر شود.
آمارها در نماهای زیر سازماندهی شدهاند:
آمار کلی (4)
آمار کلی در مورد کل مجموعه دادهها، موارد جداگانه و متغیرها.
آمار فعالیت (5)
آمار مراحل مختلف فرآیند در مجموعه دادههای شما.
آمار منابع (6)
آمار افراد یا واحدهای سازمانی در مجموعه دادههای شما.
آمار ویژگیها (7)
آمار مربوط به تمام ویژگیهای بیشتر.
در نهایت، قابلیتهای زیر را در پایین صفحه خود دارید:
فیلتر کردن (8)
کنترلهای فیلتر گزارش برای مجموعه دادههای فعلی از هر یک از نماهای تحلیل قابل دسترسی هستند. فیلترها واقعاً برای بررسی جنبههای خاص فرآیند شما و تمرکز بر تحلیل شما مهم هستند.
کپی، حذف و خروجی گرفتن از مجموعه دادهها (9)
مجموعه دادهها را میتوان مستقیماً از نمای تحلیل فعلی کپی کرد و حذف کرد. نقشهها و مجموعه دادههای فرآیند را میتوان از طریق این دکمه خروجی در گوشه پایین سمت راست خروجی گرفت. موارد، متغیرها، آمار و نمودارها را میتوان مستقیماً از طریق کلیک راست از نمای آمار خروجی گرفت.
This mode explains in detail how the statistics view works.
Statistics view
While the Map view gives you an understanding of the actual process flow, the Statistics view provides additional overview information and detailed performance metrics about your process.

نقد و بررسیها
هنوز بررسیای ثبت نشده است.